AI Realtime Monitoring
When History Repeats Itself: How to Break Free from the Cycle
Have you ever found yourself staring at a price pattern, heart racing, itching to pull the trigger, but deep down, there's a nagging feeling that it might be a trap? You’ve seen this formation before—perhaps it led to a great trade last time, but now you're unsure. The excitement of the trade pulls you in, but then there's that gut feeling: "What if this is just another trap?"
It happens to the best of us. Maybe it's the fear of missing out (FOMO), or the urge to jump in before it's too late. It could be panic or greed creeping in, nudging you to act impulsively. Maybe you’re not at your best today—perhaps emotions are high, and your decision-making is clouded by the ups and downs of the market. But you take the leap anyway… and the outcome? Often, it’s the same trap you’ve fallen into before.
This cycle is all too familiar, and the reasons behind it are deeply rooted in our behavior. Behavioral finance tells us that investors, even seasoned ones, are not always the rational, cold-blooded decision-makers they wish to be. We often act on emotion, driven by factors like fear, greed, and overconfidence, rather than relying purely on logic or data. Over time, these biases cause us to repeat the same mistakes—making decisions based on immediate emotion rather than long-term strategy.
The idea that “history repeats itself” isn't just a catchphrase—it’s grounded in Dow Theory, which suggests that markets move in predictable trends, with patterns emerging and re-emerging across time. These patterns are not random but rather a reflection of collective human behavior in similar market conditions. When you see the same pattern, you're not just seeing a random collection of candles; you're seeing the same human reactions and decisions being played out again.
Behavioral finance further supports this. It shows that the irrationality of market participants leads to repeated behaviors, such as the tendency to overreact to news, herd mentality during bull runs, and mass panic in a downturn. This creates predictable patterns that recur over time—patterns you can learn to recognize.
But how do we break free from the emotional cycle of impulse decisions and trap trading? The key is data. Historical data provides the backbone to our decisions, allowing us to see past patterns in their full context. By looking at past instances of similar price formations, we can better understand what tends to happen afterward—whether the pattern leads to a breakout or falls flat.
This is where PatternAction’s search history comes in. With the ability to search through past price patterns and see how they played out, you no longer need to rely on gut instinct or blind hope. By examining the outcome of similar situations in the past, you gain valuable context, helping you decide whether this current pattern is worth trading or just another trap.
In short, history doesn’t just repeat itself—it teaches us. Armed with historical data, you can avoid making the same emotional mistakes and trade with a clearer, more informed mindset. You’re not just reacting to the market; you’re responding to it with the full knowledge of what history has shown.
Workflow: How to Turn a Hunch into History-Backed Context
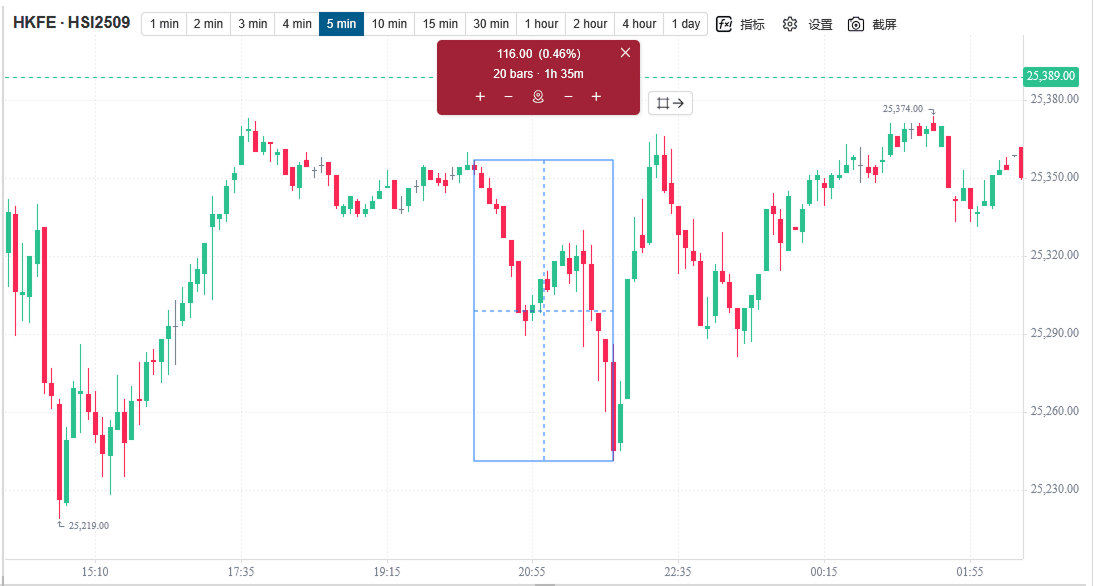
1) Spot it and box it in mView
Open mView, load the stock and timeframe you trade, slide the chart forward/back to scan, and the moment a pattern interests you, click Box-Select and frame the candles. That’s it—you’ve captured the exact pattern you want the system to look for.
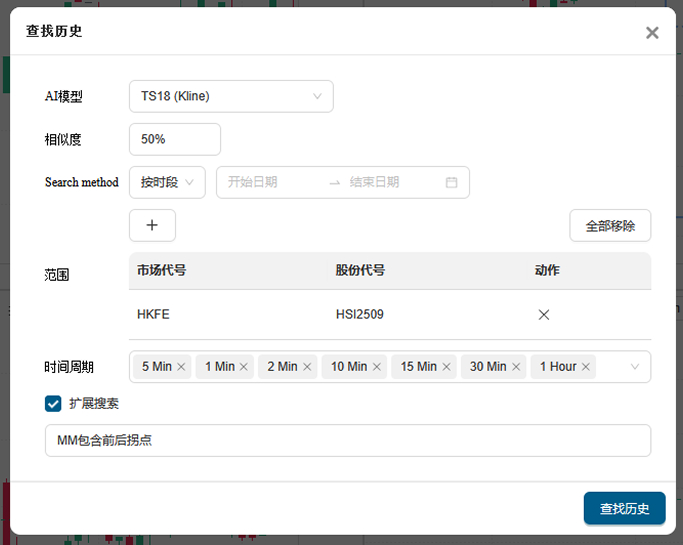
2) Tell the system what “similar” means—and where/when to look.
Set similarity to narrow in on near-clones or loosen it to study close cousins. Point the search at the symbols/timeframes you actually care about (they don’t have to match the source chart). Then choose a time range in one of two ways: either select a specific date window—useful for stress-testing around known events (for example, a war headline, pandemic shock, trade dispute, or an FOMC week)—or enter the last N days (such as 300) to sweep a recent, representative slice of market history.
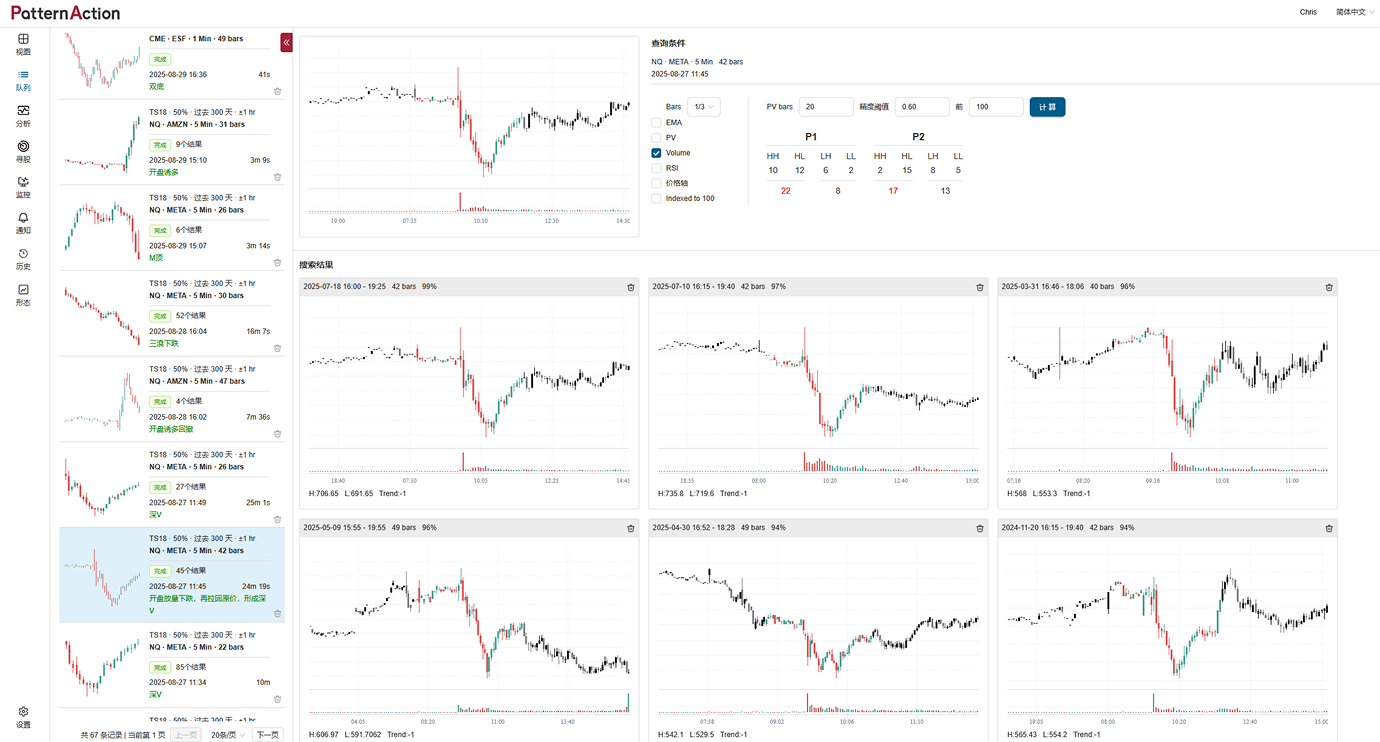
3) Review the matches like a tape replay
Head to History Search Queue and select your run. You’ll see a grid of similar cases. Each opens as an interactive chart—drag left/right around the boxed region to replay what came next: clean break, failed push, or chop. You’ll also see handy metadata: symbol, timeframe, bars counted, similarity score, and detection time.
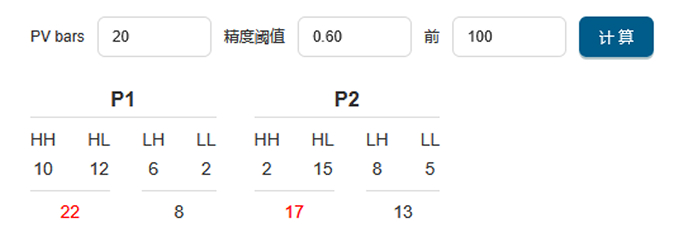
4) Quantify the “what happened next”
The Stats panel tallies what price did after the match:
- Next pivot (P1): counts of Higher High (HH), Higher Low (HL), Lower High (LH), Lower Low (LL)
-
Second pivot (P2): the same HH/HL/LH/LL breakdown
If a pattern’s results skew heavily to HH/HL with few LH/LL, the historical bias was up and you’ve got a tail wind; if it leans LH/LL, proceed smaller, later, or not at all. It isn’t a promise—it’s the distribution, but it turns a gut-feel moment into a cool-head decision you can defend.
5) Decide with data, not adrenaline
Maybe you’re ready to go long, but the matches show most similar setups rolled over; you pause or tighten risk. Maybe you’re unsure, yet history shows consistent HH follow-through; your conviction firms up. Either way, you’re not guessing in the moment. You’re trading with receipts.
With PatternAction’s History Search, you move from impulse to evidence. You don’t need to trade on nerves, memory, or screenshots anymore. When a setup tempts you, PatternAction gives you fast, history-grounded context so you can act or pass with conviction. That means fewer repeat mistakes and trap entries, less FOMO and second-guessing, clearer sizing and timing, and a calmer, more consistent process you can stand behind.