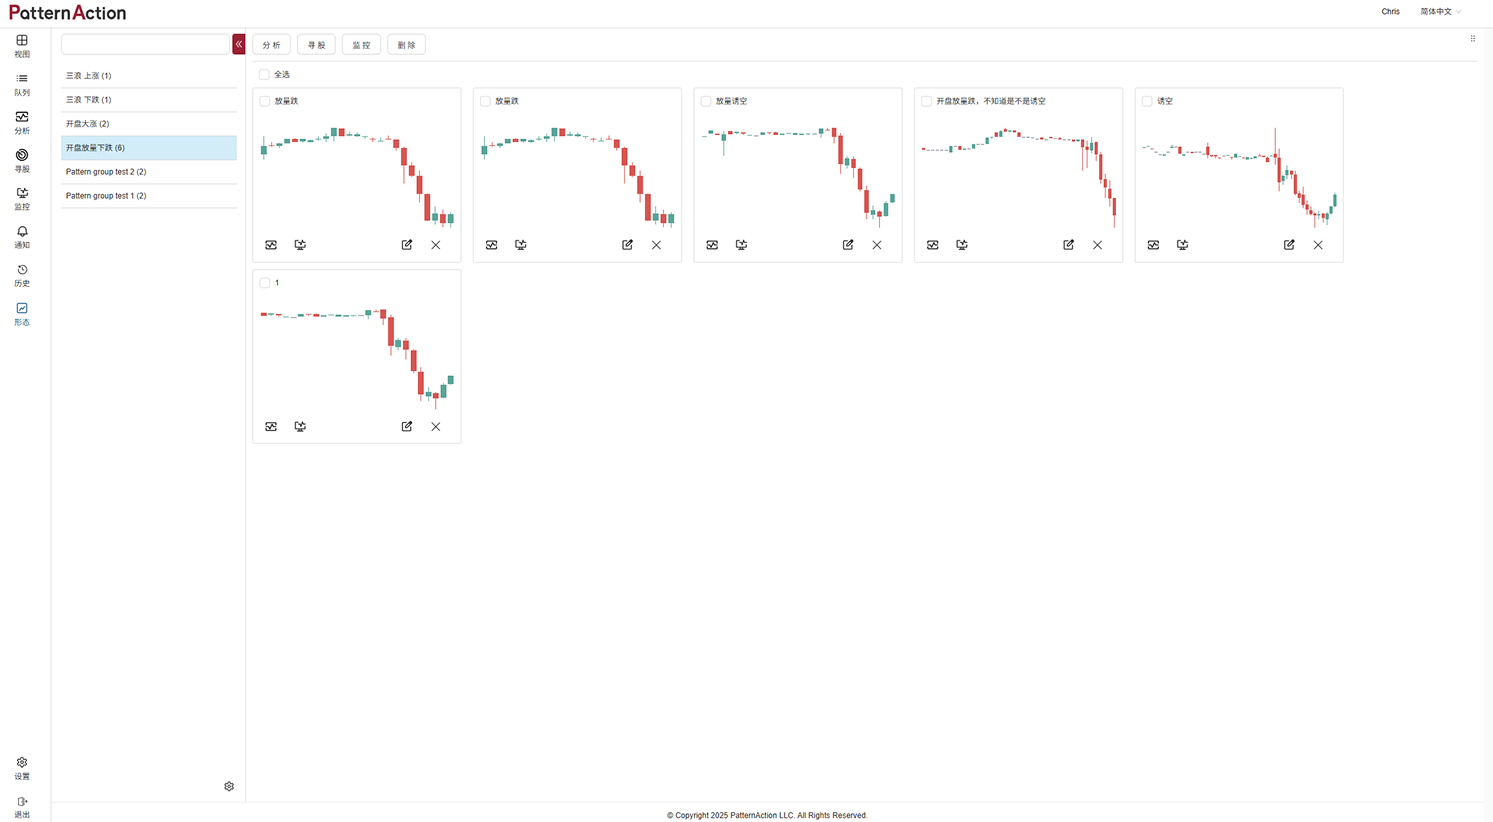
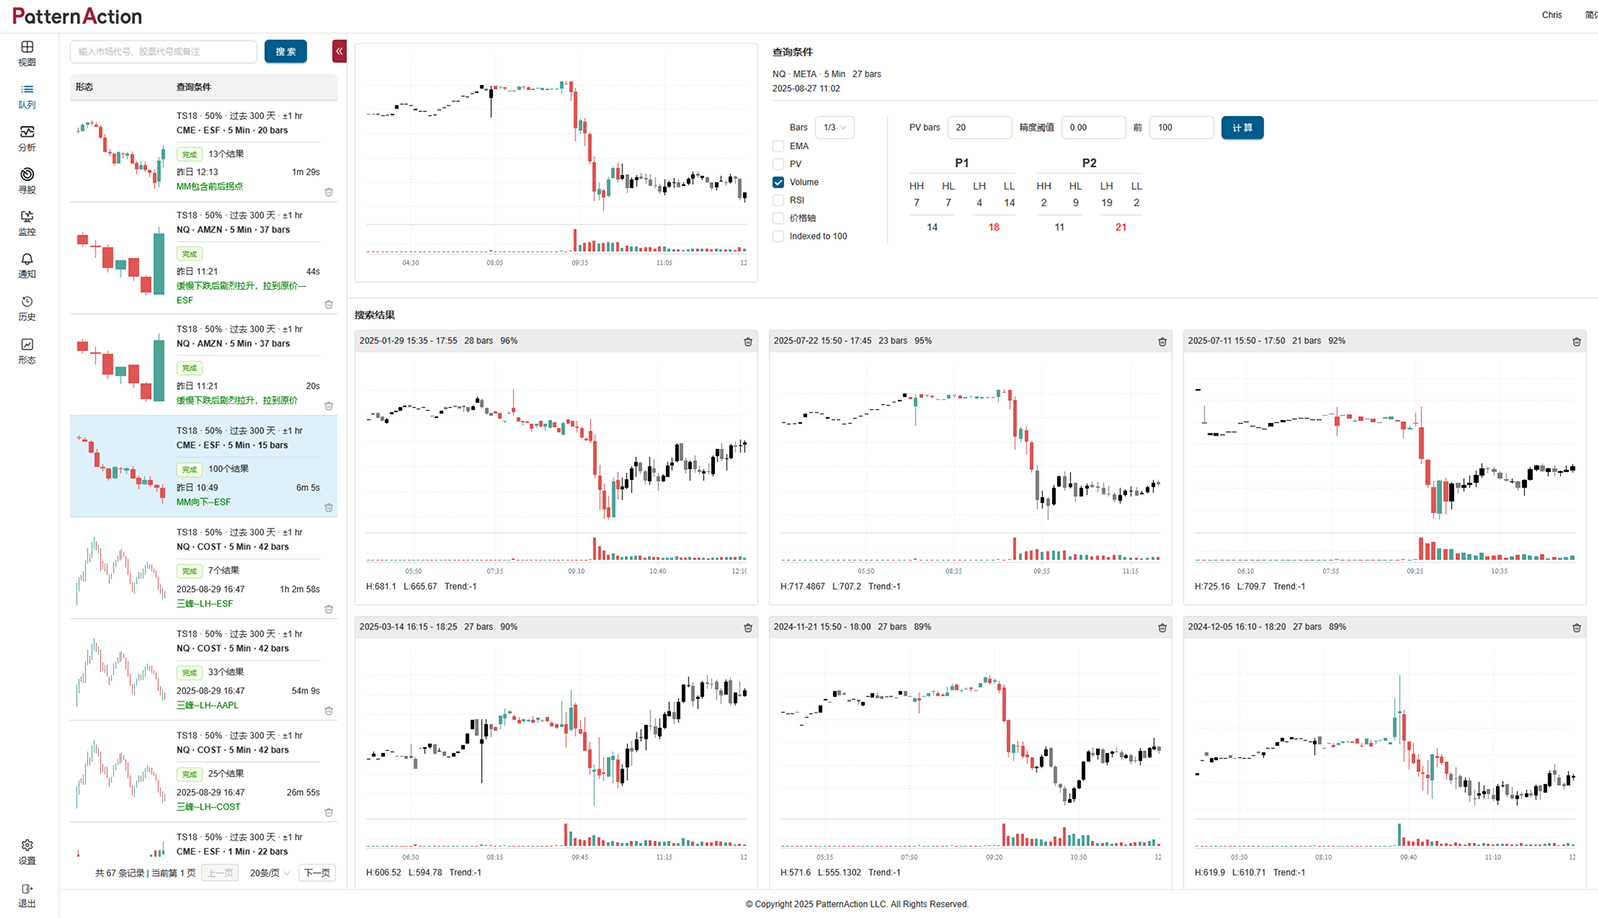
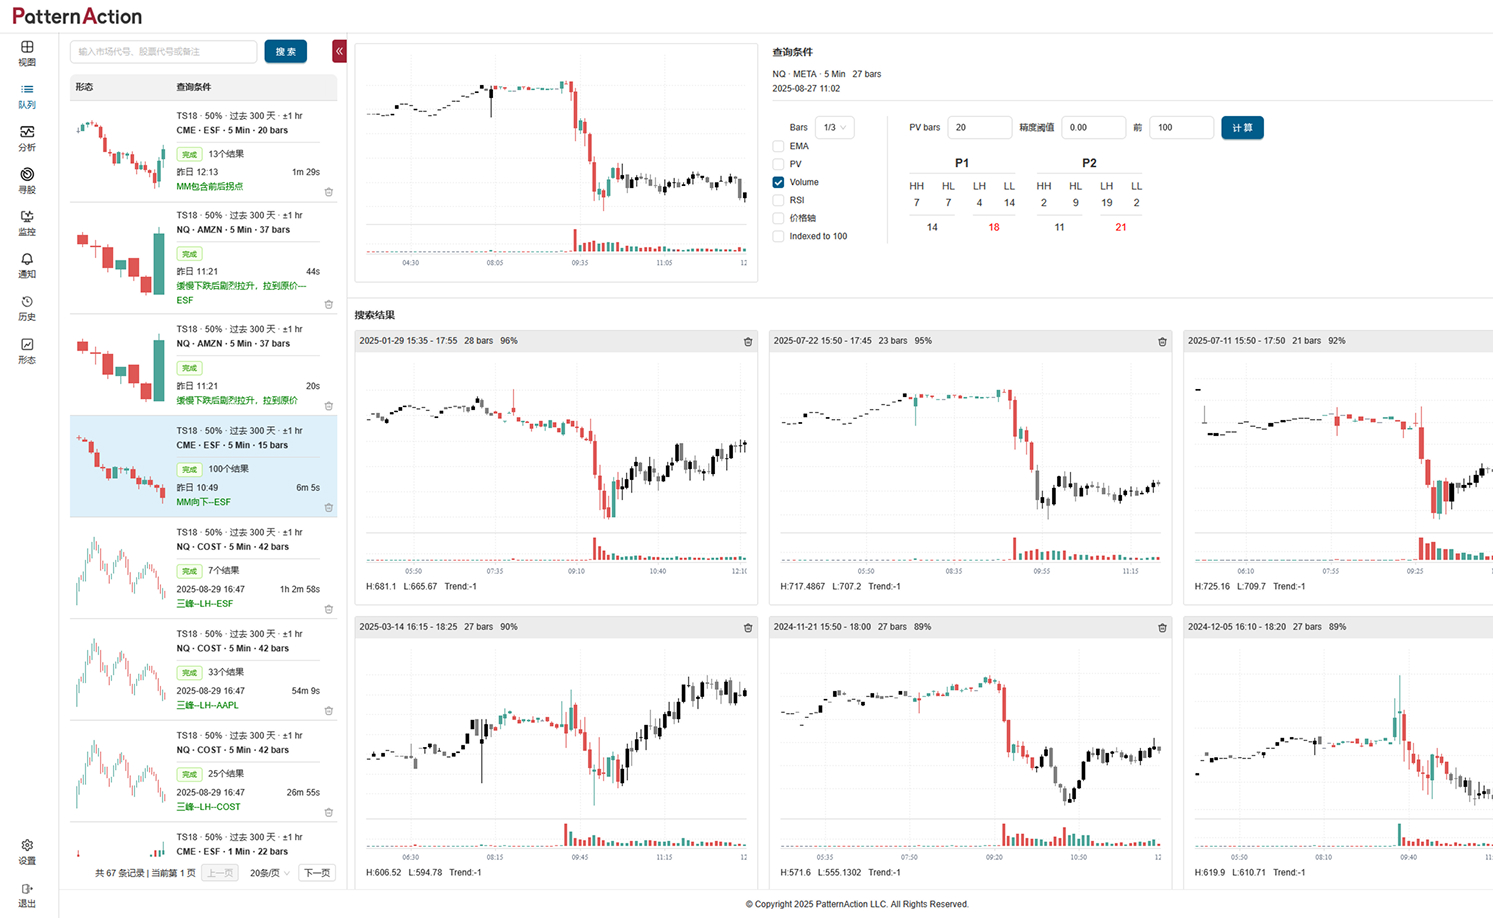
Home Education Pricing

Pattern Library

Create groups, box-select patterns right from the chart, and add quick notes resurface when alerts trigger--so your past lessons guide future decisions.

From any saved pattern, jump straight to Analyze, Finder, or Monitor.

  • Build your own pattern library that reflects your edge, not a generic list.
  • Box capture right from the chart
  • Notes pop up at the right moment to reduce emotional trades.
Try Pattern Search Watch Demo

Historical Lookup

Grounded in behavioral finance, Historical Lookup shows how markets tended to behave after patterns that look like the one you see now.

Box-select a region on the chart, set similarity and a time window, choose symbols and timeframes—even across multiples—and get ranked matches with the subsequent price paths. Use it to judge context—setup or trap—before you place a trade.

  • Box-select on chart to define the pattern
  • Tune similarity & lookback period
  • Multi-symbol, multi-timeframe in one run
  • Ranked matches with follow-on price paths
  • Outcome stats: win/loss, median move, typical window
Run a Lookup

For informational purposes only. Past performance is not indicative of future results.

Real-Time Pattern Monitoring

Never miss an opportunity—let the system track your patterns.

As a trader, it’s impossible to watch hundreds of stocks and keep track of multiple patterns all day. You need a solution that lets you automate monitoring so you never miss a pattern—even when you're eating lunch, meeting friends, or sleeping. With Real-Time Pattern Monitoring, the system does the heavy lifting for you.

No more missed opportunities

Monitor hundreds of stocks and multiple patterns simultaneously while you're away from the screen.

Completely customizable

Define your own patterns and fine-tune the criteria to suit your trading style and risk tolerance.

Stay informed, not overwhelmed

Receive real-time alerts only when the conditions you care about are met, so you can focus on what really matters.

Multiple AI models

Use specialized models for different types of patterns, with continuous updates for improved accuracy.

Peace of mind

Continuously tracks, alerts, and you decide when to act, giving you the confidence to trade on your terms with timely, accurate notifications.

Monitoring Log

Review, learn, and improve your trading decisions.

Monitoring History is where all the alerts you’ve received are stored. It’s designed to help you review your decisions and improve your strategy through post-trade analysis. After the trading session ends, you can visit this page to see all the alerts triggered by the system, within a customizable time range.

  • Track your decisions — See which alerts you acted on, which you didn’t, and evaluate whether those decisions were right or wrong.
  • Review outcomes — Did the pattern result in a profitable trade, or did it miss the mark?
  • Learn from the past — With the benefit of hindsight, look at the market context and the subsequent price action to understand your choices better.
  • Make improvements — Use this post-trade review to refine your strategy, adjust risk tolerance, and make more informed decisions moving forward.

Stock Finder

Find where your pattern is forming—right now.

When you can’t watch every symbol, Stock Finder scans your lists and shows the symbols and timeframes that currently match your pattern(s), so you spend time reviewing candidates—not hunting charts.

Start from the Library, set similarity, choose timeframes, batch-add symbols or entire groups, and run the scan. Results are ranked so you can jump straight to the chart—no advice, just candidates to review.

More opportunities, same screen time

Scan dozens or hundreds of symbols and multiple timeframes at once, reducing manual chart hunting.

Precision and Flexibility

Adjust similarity and timeframes to find the best matches for your strategy.

Expands Trading Opportunities

Monitor more stocks and uncover more patterns without being limited to a few tickers.

Increases Trading Frequency

Quickly identify setups across different timeframes, perfect for active traders.

Batch Processing for Efficiency

Search multiple patterns or entire stock groups at once, streamlining your analysis.
Run Stock Finder

No trading advice provided.

Pattern Analysis

Quantify how this pattern tended to behave—before you act.

Turn a saved pattern into research. Set similarity and a lookback window, and run a study across chosen symbols and timeframes. We surface past occurrences and summarize what typically happened next, so decisions are guided by data—not impulse.

Probability at a glance

Up vs. down rates by symbol/timeframe, with case counts.

Quality control

Higher similarity = fewer, closer matches; lower = broader coverage.

Consistency

See whether outcomes cluster or vary widely.

Typical move & pullback

Common gain/loss and the usual initial dip to size risk.

Time window

When moves most often unfold after the pattern.

Price paths

Open matches to view the “what happened next” curve.
Run Stock Finder

No trading advice provided.